

By Julian Barton, EGM | Feedback ASAP | feedbackasap.com
If you’ve already got a traffic counting system running in your stores, this one’s for you. In Episode 5 of Traffic to Growth, I sat down again with David King from ShopperTrak, and this time we didn’t talk in theory. We walked through a real, live dataset from one of David’s retail clients, tracked over several months on ShopperTrak’s Video AI platform. Not to show off a dashboard. To dispel a few assumptions a lot of retailers are quietly making about their own traffic data right now, today. And in some cases, it’s costing them real money.
The Problem: A Number That Looked Complete, But Wasn’t
Watch this part: What are your traffic numbers actually saying? (3:00)
Most retailers running a people counting system have had it in place for years. They know their footfall. They know their conversion rate. And because they know it, most stop asking whether the number is still telling them the full story.
That’s exactly what happened here. In the first couple of months of tracking this store, average dwell time sat around four and a half minutes. In David’s world, that reads a specific way: high-throughput, low-dwell. Customers walk in knowing what they want, get it, and leave. Quick missions. Efficient, but shallow.
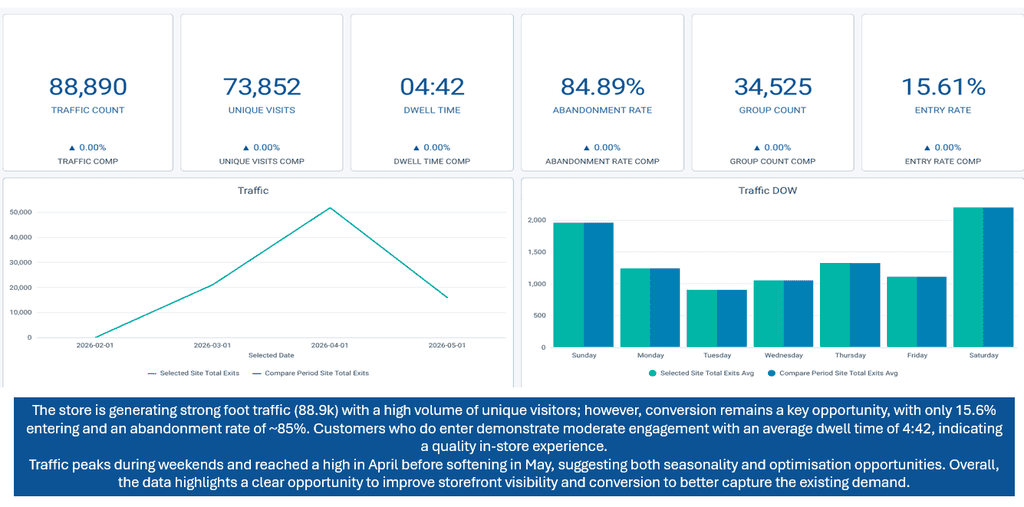
If the analysis had stopped there, that’s the story that would have been written. Build the strategy around speed and convenience, move on. It’s a reasonable call to make. It’s also the exact trap this episode was built to expose.
Watch this part: Dwell time nearly doubled, why? (4:24)
Two months of data on a seasonal, weather-affected, promotion-affected retail environment is a snapshot, not a verdict. So the team let it run. By August, on a year-to-date view built off almost a million passers-by instead of a few hundred thousand, average dwell time sat at around eight and a half minutes. Nearly double. On a far bigger, far more reliable sample.

A customer spending eight or nine minutes in your store or team isn’t passing through anymore. Something is holding their attention. The only real question is what, and whether you can repeat it.
The Impact: Proving It’s Real, and What It Costs If You Miss It
Watch this part: More data confirms the shift (5:17)
The obvious objection is the right one to raise. Early numbers move around. Small-sample noise settles down. So is this genuine, or is it just the dataset finding its feet?
Three things gave David’s team confidence it’s real. First, sample size. The dataset went from around four hundred thousand passers-by in the early read to nearly a million by August. That’s not a rounding correction. That’s a fundamentally more reliable dataset, and the trend held under the extra weight rather than disappearing.
Second, everything else about the customer stayed almost perfectly stable across the same window. Same gender split, roughly six in ten women to four in ten men. Same dominant age group, 19 to 40. Same shopping behaviour, still mostly solo shoppers or pairs. Nothing about who was walking in, or how they were walking in, changed. It’s not a different customer showing up. It’s the same customer behaving differently, and when the audience is constant and only one behaviour moves, consistently, over months rather than days, that’s not noise. That’s a genuine shift in how the customer is experiencing the store.

Third, and this is the one that should land hardest for anyone who checks their dashboard and moves on: the business had this data the whole time. The early read was sitting right there on the same platform, looking complete, looking actionable. It just wasn’t the full picture yet. You can have a live, accurate dashboard and still be making decisions on half a story.
Watch this part: How are YOU making decisions now? (6:30)
There’s a second layer to this, and it isn’t all good news. Draw rate softened across the same period. Early on, it was tracking above 15 percent. By August, it had eased to closer to 14 percent. Still a strong number by any benchmark, but the trend line is down, not flat. Fewer people walking past are choosing to walk in.
Here’s why that matters more than it looks. Most retailers only watch one metric at a time. You could be watching draw rate hold steady on a dashboard and completely miss that engagement is quietly doubling underneath it. Or the reverse. A single number like footfall, or even conversion on its own, can lull a business into a false sense of security. This store had two different stories running in parallel, layered on top of each other, and a single-metric view would only ever have caught one.
This is the same trap we see constantly in CX measurement, just wearing a different uniform. A store or team can hold a steady NPS for months while the actual drivers underneath it shift completely, some improving, some quietly eroding, and the single score never moves enough to raise a flag. Whether it’s dwell time or a satisfaction score, one number was never built to carry that much weight on its own. It tells you something moved. It doesn’t tell you what, where, or what to do next. This lines up with Deloitte’s 2026 Global Retail Industry Outlook, which puts up to 40 percent of a retailer’s brand value in customers’ eyes on factors that have nothing to do with price, including service, checkout ease and staff interactions.
The Action: Turning a Behavioural Signal Into a Repeatable Habit
Watch this part: Which lever are you pulling, and why? (8:10)
So say you’re running that store or team and you’ve just absorbed all of this. Dwell time’s up. Draw rate has softened slightly. You know exactly which hours and which days matter most. What do you actually do differently tomorrow?
Watch this part: Power Hours and optimising sales conversions (8:57)
The trading pattern gives you the where and when. Power hours here are tight, roughly midday through mid-afternoon, with weekends clearly outperforming weekdays. That’s where the engagement opportunity concentrates, so that’s where the best people need to be on the floor, fully present, not stretched thin across a quiet period somewhere else. Early on, the job was proving this store could convert passers-by into visits at all. That’s proven now, repeatedly, across a much bigger dataset. The job today is more precise: restore that peak conversion rate while protecting the engagement gain that’s already been won.

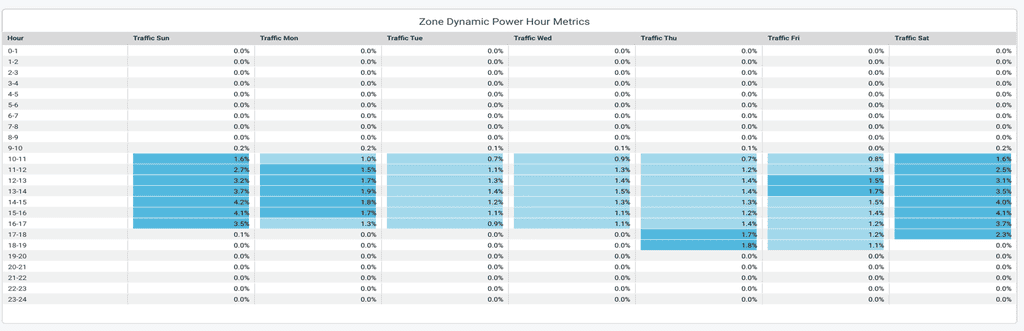
That solves the where and when. It doesn’t solve the harder question, and this is the gap most retailers skip entirely. Knowing dwell time went up doesn’t tell you what to actually say to that customer, or what the team needs to be doing differently in the conversation itself.
This is exactly where a lot of businesses reach for the wrong tool. A tick-and-flick survey at the end of a visit won’t tell you that. A single rating question at checkout, how was your experience today, one to five, is close to useless on its own. And the old habit of sending in a mystery shopper won’t get you there either. A mystery shopper measures compliance against a checklist. Did the team member greet them, did they mention the promotion, did they follow the steps. That’s an audit of operational standards. It has its place, but it’s not what’s driving someone to stay twice as long, or come back and tell a friend.
Not a vague instruction to try harder. A specific, named behaviour to repeat, in the exact windows the traffic data says matter most.
Watch this part: What earned the extra 4 minutes of dwell time (11:07)
What actually gets you there is the real, unscripted voice of customers who were genuinely there, listened to at scale, so you can identify the specific behaviours creating advocates. Not just satisfied customers who tick a box and leave. Advocates. People who talk about the experience afterwards, who bring someone else next time, who leave a genuine Google review without being asked.
Watch this part: Building an operating rhythm (12:00)
Once a team knows which specific behaviour is doing the work, whether that’s a particular way of greeting someone, a product conversation, or how a team member handles a fitting room or a query, they know what to do next. Not a vague instruction to try harder. A specific, named behaviour to repeat, in the exact windows the traffic data says matter most. Then you track improvement over the coming quarter the same way you’d track any other performance metric, so the insight isn’t a one-off that fades in a month. It’s a habit the store or team builds on.

The Outcome: Traffic Gets Them In. Conversation Keeps Them Coming Back.
Watch this part: Traffic to Growth in one sentence (13:00)
Get that conversation right and a store or team is doing two things at once. It’s maximising the sales opportunity standing in front of it today, and it’s building the word of mouth and referrals that bring a brand new customer through the door next month, one it didn’t have to pay to acquire.
That’s the real link back to this episode, and the whole arc of the series. Traffic gets someone through the door. Engagement, the kind showing up in this dataset, gets them to stay. But it’s the conversation happening inside that dwell time that decides whether they become a repeat customer, an advocate, or just a number that walked out again.
The customer in this story hasn’t changed. The mission hasn’t changed. But engagement is stronger than anyone first measured, and arguably that’s a more valuable discovery than the original conversion story ever was. The question worth asking isn’t who shops here, because most retailers already think they know that answer. It’s whether you’re still curious enough about your own numbers to find the story sitting underneath them.
If you’ve got a counting system running, dashboards live, reports landing in your inbox every week, and you haven’t asked that question of your own data in a while, this is your sign. The number on the screen is never the whole story. It’s the start of one, and the businesses pulling ahead are the ones willing to keep digging until they find where it actually leads.
Frequently Asked Questions
What does rising dwell time actually mean for a retail store or team?
Rising dwell time means customers are spending longer in meaningful engagement, not just passing through. On its own it doesn’t explain why. That takes pairing the traffic data with real customer voice to identify which specific behaviours are holding attention and driving advocacy.
Why isn’t a bigger dataset always the full story straight away?
Early data on a seasonal, promotion-affected retail environment is a snapshot, not a verdict. Sample size, demographic stability and a trend that holds over months rather than days are what separate a genuine shift from small-sample noise.
What’s the difference between a mystery shopper and real customer voice?
A mystery shopper audits compliance against a checklist, whether a step was followed. Real customer voice, captured through video, voice or text, reveals what actually earned the customer’s attention and whether it’s building advocacy, not just satisfaction.
How does traffic data connect to Feedback ASAP’s Results Booster Hub?
Traffic intelligence from platforms like ShopperTrak’s Video AI answers when and where engagement is happening. The Results Booster Hub answers what to do about it, turning real customer voice into a specific, prioritised behaviour for the team to repeat in those exact windows.
How long before a store or team sees results from acting on this kind of insight?
Most teams see measurable movement within weeks, because the approach is built around one specific, named behaviour tracked over a quarter, not a full program overhaul.
Worth a conversation? Reach out to the Feedback ASAP team. We will listen first, map the gaps, and help you design a program that reflects your culture, your priorities and your full customer opportunity.
Most CX programs measure. We improve.